


Supplier Dashboard II: How Zumen simplifies supplier evaluation
Business | November 03, 2022 | By
Welcome to the second blog of the Supplier Dashboard series. In the first blog, we talked about the importance of dashboards in procurement, especially in supplier relationship management, and how you can intuitively zoom in and zoom out with Zumen’s Supplier Dashboard to get to the nitty gritty of supplier evaluation and performance management.
Now we are on to the next. Let’s jump right in.
Manufacturing companies face a myriad challenges in managing their supply chain. And, thanks to infamous supply disruptions, the challenges have multiplied. Like Dr.Watson to Sherlock, or Alfred to Batman, manufacturers need suppliers who can withstand any challenge and deliver, quickly plying to changes, and master new technology to produce, and even design components. All of which will help them wade through the challenges unscathed. Adding on, since nearly 70% of the parts of a product come from suppliers, the importance of efficient supplier evaluation and performance management cannot be emphasized more.
Light at the end of the tunnel
Even today, manufacturers manually handle most supplier management processes. And it is shocking that when it comes to supplier performance and evaluation, a key aspect of SRM, the data is not the same across the organization. Manufacturers obtain the data from numerous channels and systems and manage the volume of information (including on-time delivery metrics, quality, cost performance, and other KPIs of suppliers), which is an arduous effort. And so, manufacturers often end up working with inexperienced or unsuitable suppliers. The result, well…all hell breaks loose.
And the solution is not superheroes, but your own buyers. It is time they wear the capes and quash the challenges with the right sourcing and procurement platform. And that is Zumen – a comprehensive Source-to-Pay platform that adds the ‘super’ to your ‘hero’ buyers.
Super Supplier Dashboards
 The Batcave is where Batman monitors all crisis points. It is where he takes stock of the crisis and comes up with ideas to quell them. Imagine having such a vantage point where you can monitor all your supplier performances on a single screen. You will know where your suppliers stand – and can assess if they are on the right track or not. That’s the kind of visibility Zumen brings to the table.
It’s not necessary that you have a Batcave beneath your office or factory or build a high-tech facility to experience it. It’s called Supplier Dashboards in Zumen. You get a 360 view in a single frame. And it’s not rocket science.
Purchase Value
In the supplier dashboards screen, the first thing that you see is the field “Top suppliers based on the Purchase Value”. This graph shows the cumulative PO values handled by the suppliers in the company’s supplier network. All you need is this graph, ready to use,- whether for sourcing strategy or report generation. Also, let’s assume that a particular supplier ‘X’ has the highest purchase value. But it may not mean that the supplier is performing optimally to increase orders with them. The supplier could even be gouging prices consistently. You can immediately find this and take action when you review the dashboard for that particular supplier. (More on this in our next blog.)
Supplier Ratings
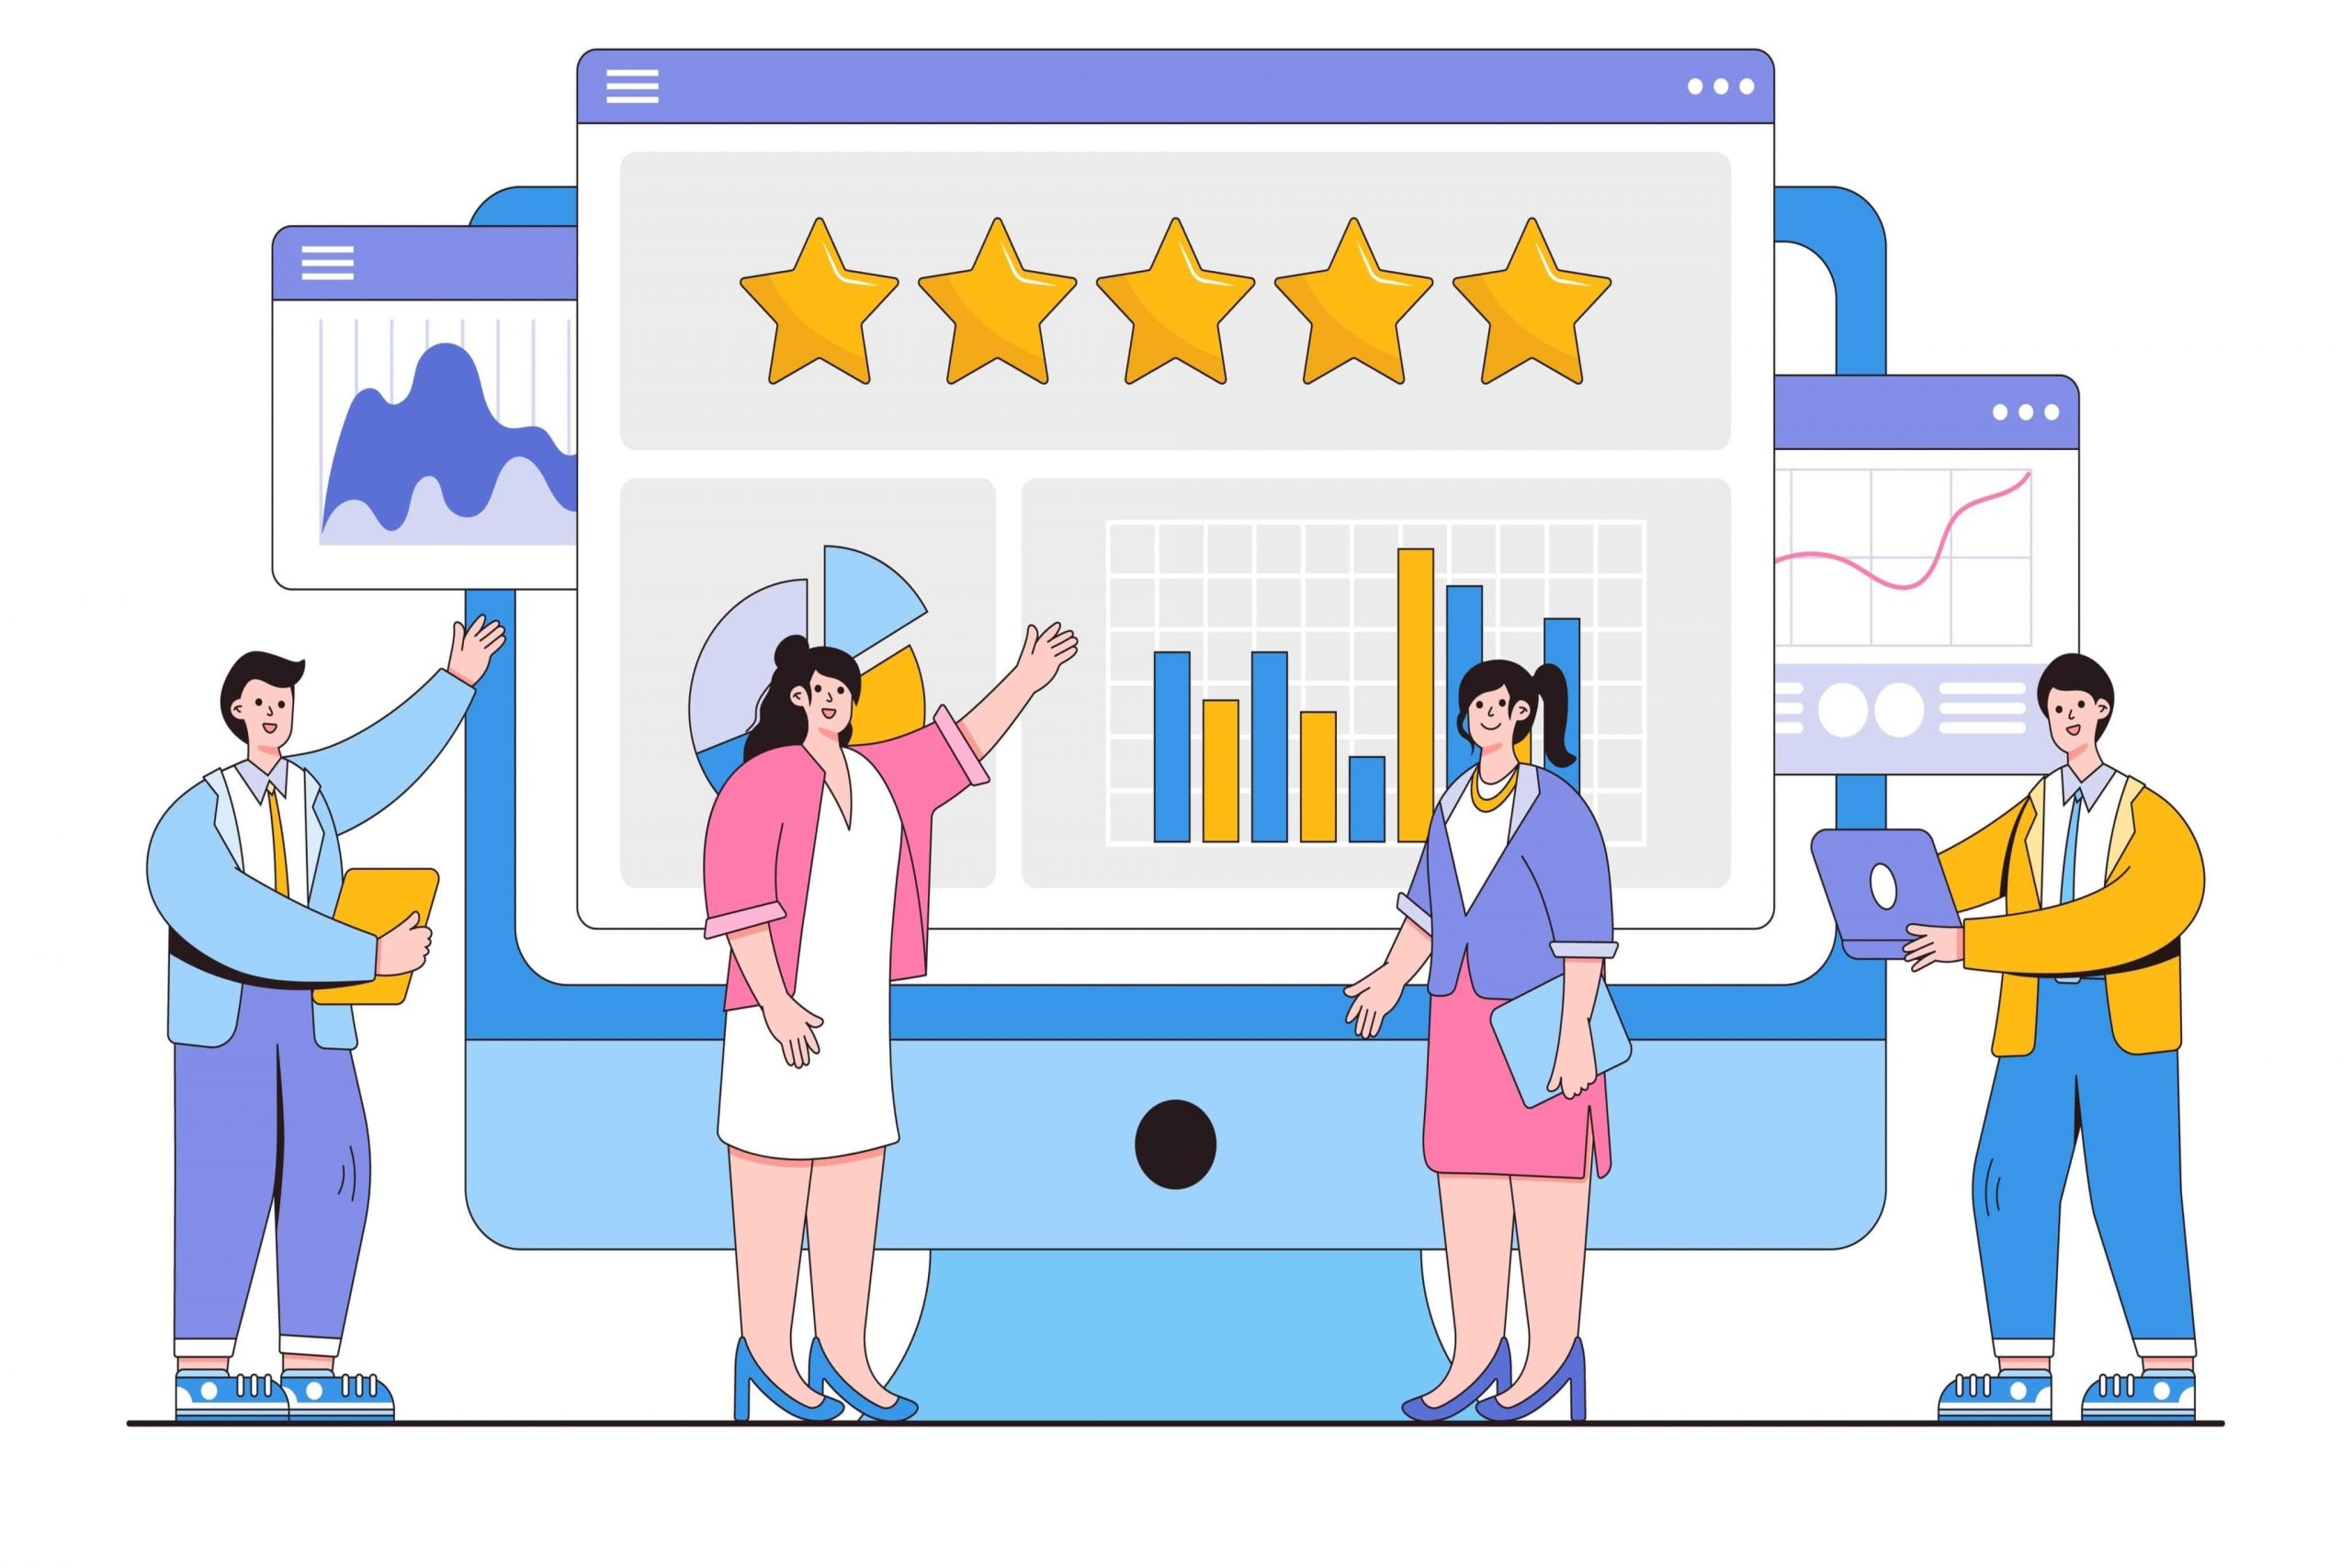 Zumen ensures that the supplier rating is done in the simplest possible way. And it gives you the control of how you evaluate them. You can create your own evaluation templates for suppliers. And coming from the manufacturing space, it needn’t be said that each commodity needs to be handled differently. So, in Zumen you can create multiple evaluation templates based on each commodity. You can also customize the evaluation criteria, add instructions, and even decide the weightage each evaluation item will carry. Further, you can select the right evaluation template from among the multiple templates. Once that is ready you give the ratings and the software populates them into a graph, real time.
Quality and Delivery (time)
Probably the two most sought-after factors considered by manufacturers after cost are quality and delivery (time). Quality is determined by acceptance and rejection rates. Whereas delivery (time) is determined by timely delivery and delays. And Zumen can show you, on a single screen, all four attributes via two stacked bar graphs.
The on-time and delay rates are stacked together to form the supplier-by-delivery bar graph. It helps you infer how your suppliers are in terms of meeting their delivery commitments. Also, if your upcoming project has tight deadlines, you can now know which suppliers to consider, without breaking a sweat.
In the suppliers-by-quality bar graph, the acceptance and rejection rates are stacked above each other. You can see how each supplier has performed in terms of quality from the time they entered your supplier network.
Supplier Health Scatter Plots
Well, you now know suppliers who are the best at meeting their delivery commitments and the suppliers who conform to your quality standards. But what if a supplier is competent at one and terrible at the other? You certainly wouldn’t want to spend almost half a day preparing this one graph. And for that we have a solution!
With Zumen, using the Delivery vs Quality scatter plots, you can find suppliers and figure out how proficient they are in terms of delivery and quality. You can also determine the overall health of your supply network. If, on average, your suppliers are performing well in meeting delivery commitments, but are sub-par in providing quality products, this graph will give you that information.
Using the stacked bar graphs and the supplier health scatter plots you can draw a whole host of inferences to evaluate your suppliers. Here are a few:
-
-
- Consider suppliers for selection for a new project (Though these are not the only factors, they play a key role).
- From the graph plots, find suppliers who are weak performers and work with them individually to improve delivery and quality aspects. This helps you intervene at the right time and prevent any serious mishaps that might even derail your projects.
- Set targets to improve your suppliers’ performance. For example, you can set a target to improve the delivery rate of a particular supplier by 15 percentage points or increase the overall supplier product acceptance rate by 10 percentage points, with inferences from the scatter plot.
-
So, the next time when your manager asks your team to rate your suppliers there will be authentic data and unbiased ratings, for which you need not spend days preparing an out-of-date report.
Pending statuses (POs and Accounts Payables)
Preparing pending supplier deliveries and accounts payables statuses is laborious. With Zumen, you needn’t spend any time poring over emails, endless calls, pasted links, and collating data from multiple sheets. Just enter the supplier dashboards screen and scroll all the way down, you will see the two tables waiting for you. You can contextualize and customize the columns you need for every specific update. And with custom filters, you can review pending delivery and accounts payable statuses, either as individual POs or all of them. Your team gets a clear picture of what deliveries are pending and can take immediate action to not miss project deadlines. And by settling your POs in advance you can take advantage of the early payment discounts too!
Supplier evaluation needs a purpose-built solution
At Zumen, we believe supplier evaluation and performance management is a key aspect of the supplier relationship management process. You and your suppliers share a profound bond. What one does affects the other, for better or for worse. Without stellar support from your suppliers, building supply chain resilience and improving operational capability becomes a near impossibility.
Zumen can help you evaluate suppliers by handling all the heavy lifting. The data is at your disposal. Furthermore, you can closely monitor supplier performance, program by program or in a 30000 feet view, with overall supplier performance information. Whatever suits you. With all supplier performance under one roof, Zumen saves you the hassle of working with multiple tools and helps your teams engage strategically with suppliers. If you would like to take a look at what we do, schedule a free demo.