


Dashing All The Way: Supplier Relationship Management with Dashboards
Business | January 11, 2023 | By
Supplier Relationship Management is an imperative part of the manufacturing process. And primarily critical to procurement. Essentially, it is the process of building and maintaining strong, productive relationships with the organization’s suppliers. And it involves managing the interactions between the buyer and suppliers, as well as developing strategies and policies to optimize the relationship. The eventual goal of good Supplier Relationship Management is to ensure that the organization has access to the goods and services to meet its requirements at the best possible prices, while also maintaining sustainably strong partnerships with its suppliers. And this can help organizations save money, improve their operations, and build long-term competitive advantages in the long run.
With reference to procurement, Supplier Relationship Management is an important facet of everyday operations and process. SRM is the step in the process that helps procurement teams source and deliver the requirements in the best possible terms for the organization’s products, be it NPD or GTM. Building strong relationships with suppliers is essential and can help procurement teams negotiate better prices and delivery schedules, which can save the organization money and improve its operations. In addition to this, strong supplier relationships provide procurement teams insight and a better understanding of the market, the variety of products and services available, which can help them make better decisions. With the right strategies and communication, effective supplier relationship management builds trust and understanding with suppliers, leading to better collaboration and innovation. In light of the bigger picture, organizations achieve better results and build long-term competitive advantages.
Technology and SRM
Technology indeed plays a big role in improving SRM by providing tools to automate, streamline, and optimize various aspects of the supplier relationship. There are popular use cases as to why supplier relationship management software is relevant and imperative to the process:
- Electronic Data Interchange (EDI) and other forms of digital communication can be used to automate the exchange of information with suppliers, reducing the need for manual data entry and increasing the speed and accuracy of communication.
- Supply Chain management (SCM) Software can provide real-time visibility into inventory levels, order status, and delivery schedules, helping companies to more effectively manage their supply chain and respond to disruptions or other issues.
- Spend analysis tools can be used to track and analyze how much money a company is spending with different suppliers, providing valuable insights into where cost savings can be made or where risks may exist.
- Vendor performance management systems can be used to track and evaluate the performance of suppliers based on metrics such as on-time delivery, quality of goods or services, and responsiveness to customer needs. This can help companies identify which suppliers are the most reliable and which ones may need improvement.
- Self-service portals, chatbots or AI-driven systems can be used to enhance communication and collaborative efforts with suppliers, allowing them to access real-time information and manage their own data.
Leveraging all or some of these technologies, depending on individual organizational requirements, companies can gain a more comprehensive view of their supplier relationships and make more informed decisions about how to optimize them. And making that view effective, informative and user friendly are dashboards.
Dashboards Are….
Dashboards are a visual display of data that can be used to track key performance indicators and other metrics. They help consolidate and organize data from multiple sources, such as databases, spreadsheets, and other systems. This allows users to quickly see the data that is most important to them, and to identify trends, patterns, and other insights. Dashboards are used in many different fields, including finance, marketing, and operations, and can help organizations make better decisions, improve their operations, and gain a competitive advantage. They are a valuable tool for businesses and organizations, because they help in quickly understanding and analyzing large amounts of data.
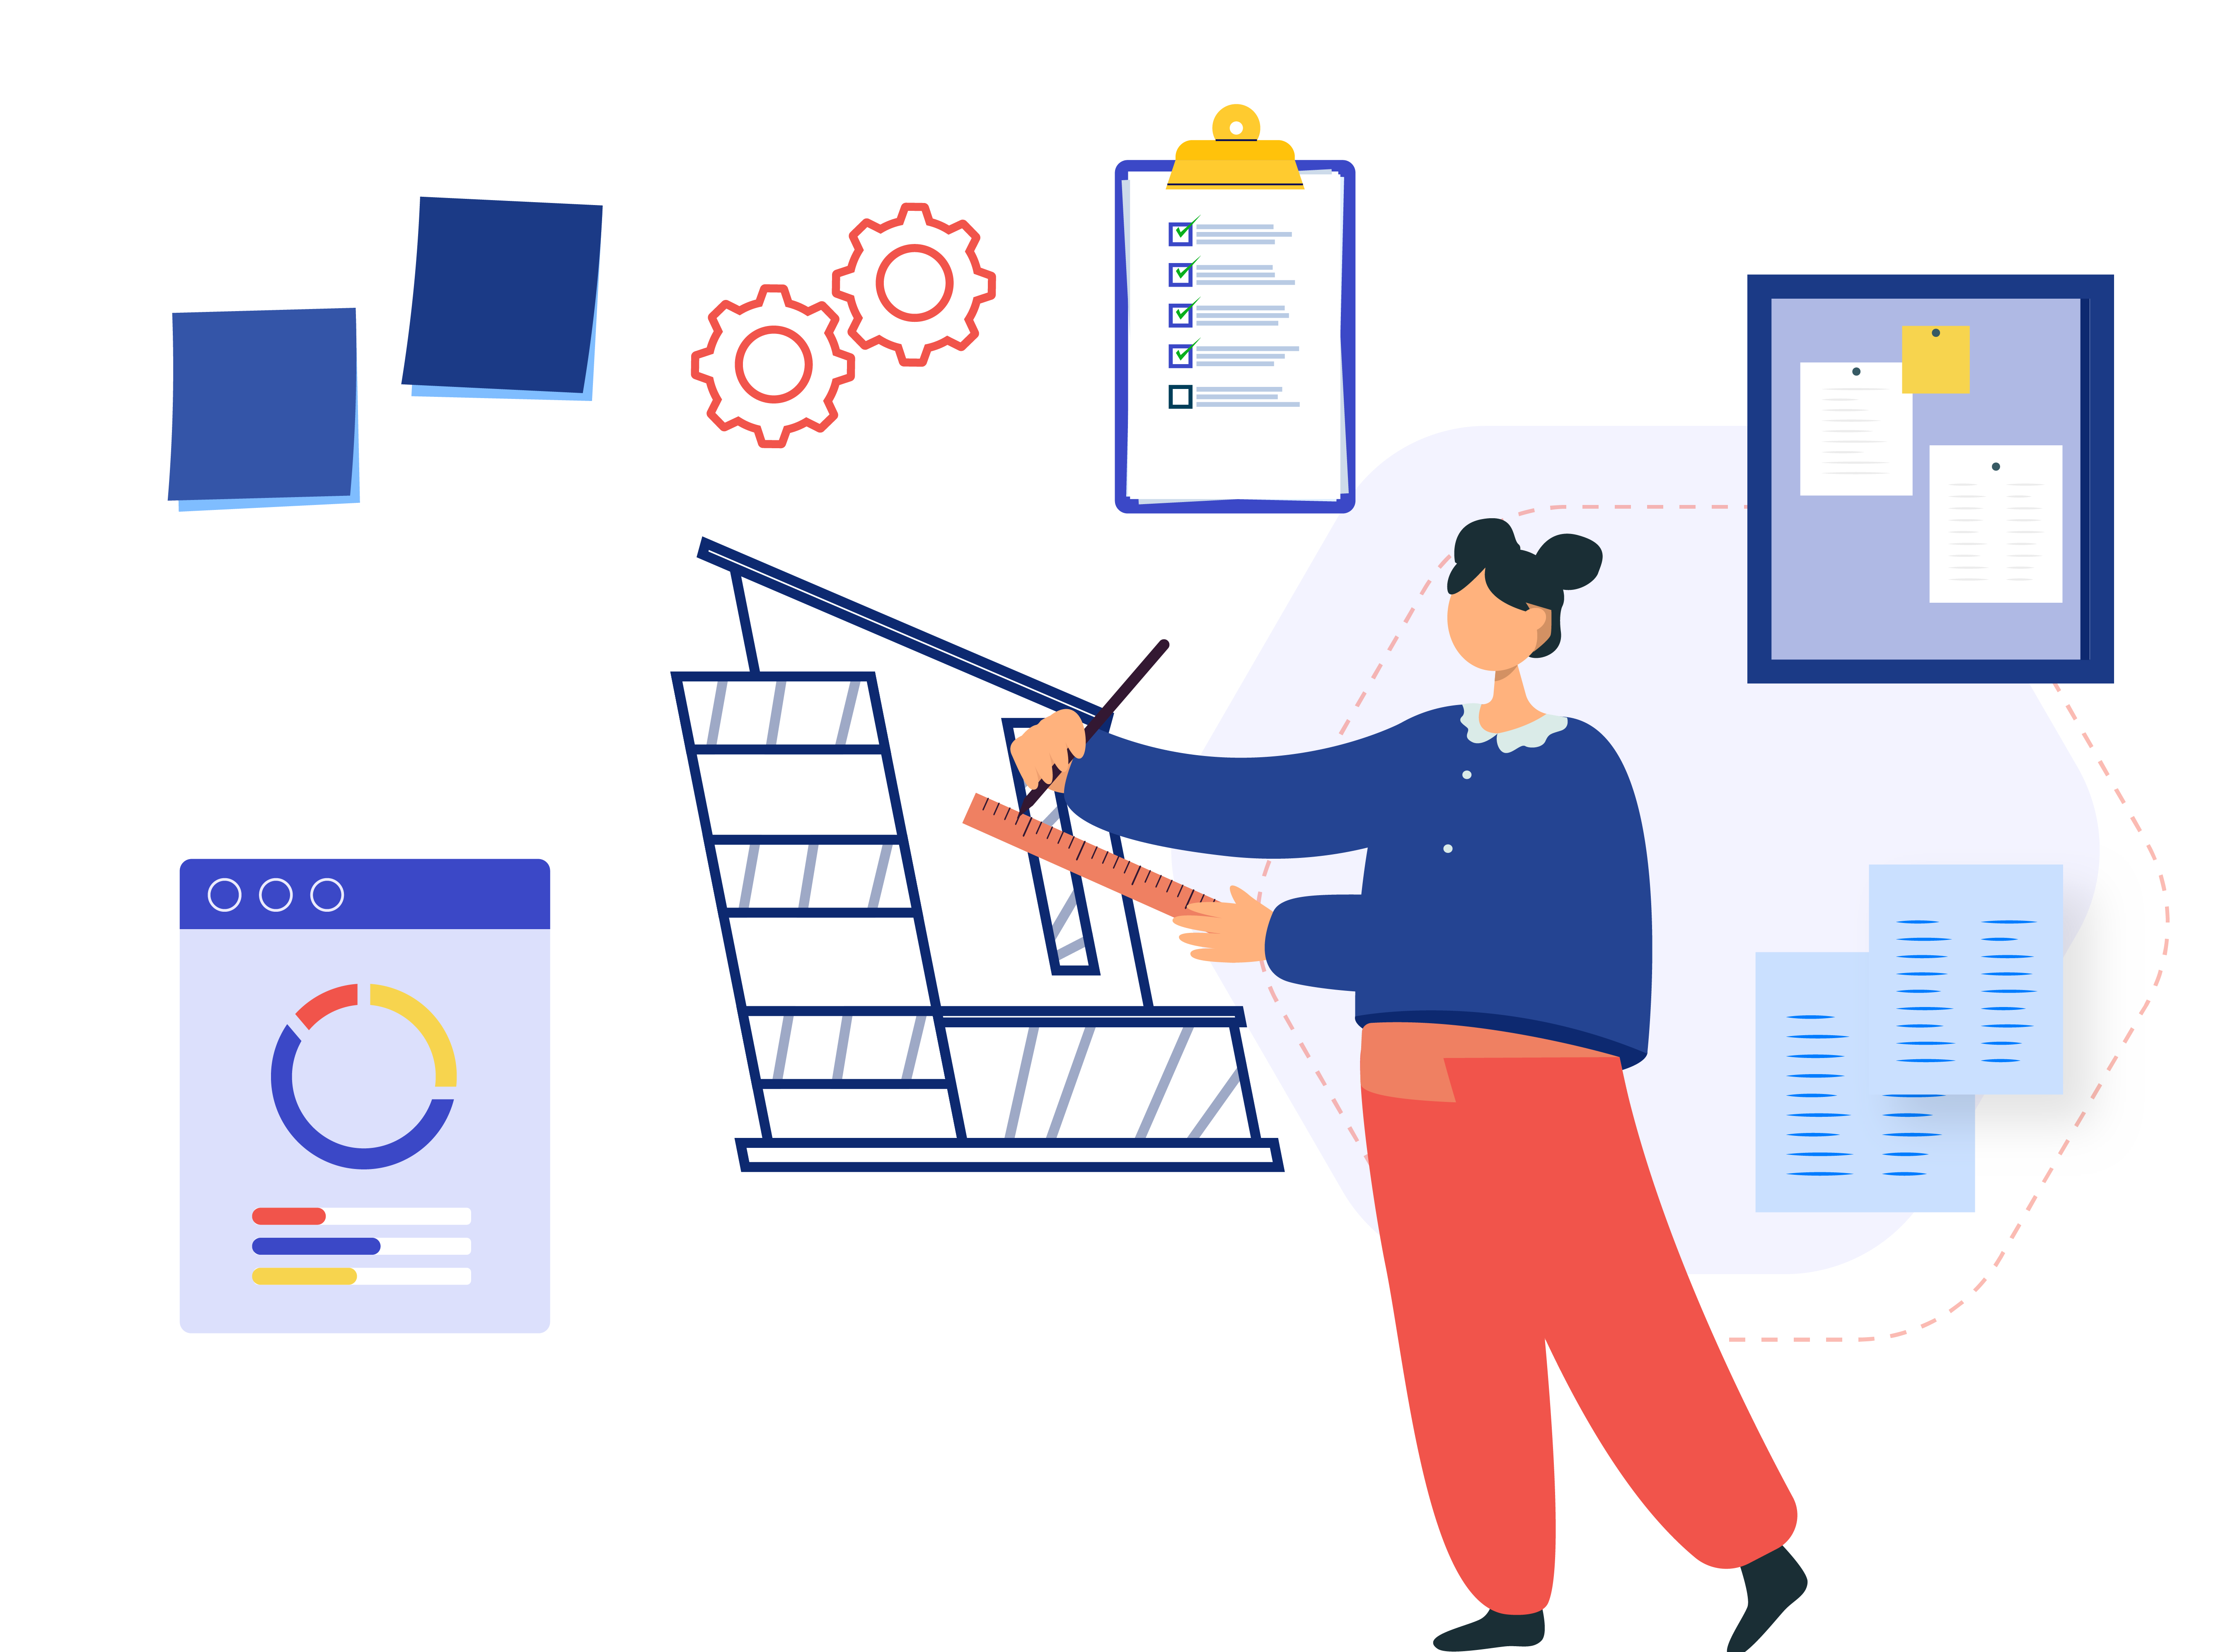
Designed with thought
The design principles behind dashboards focused on making the data easy to understand and actionable. Some of the key design principles for dashboards include the following:
Clarity: Dashboards should be easy to read and understand, with clear, concise labels and visualizations.
Relevance: Dashboards should display only the data that is most important and relevant to the user, and should avoid showing unnecessary or irrelevant information.
Consistency: Dashboards should use a consistent design and layout, with a consistent color scheme and other visual elements.
Flexibility: Dashboards should be flexible, allowing users to customize them and drill down into the data to get more detailed information.
Actionability: Dashboards should provide users with the information and tools they need to take action based on the data.
The design and user experience (UX) of a dashboard have a significant impact on how users interact with the data and make decisions. Well-designed dashboards are easy to read and understand, with clear, concise labels and visualizations. It will present relevant information intelligently, showing only the data that is most important to the user. On the flipside, poorly designed dashboards may be difficult to read, with cluttered or confusing visualizations, or may show irrelevant or unimportant data. This can make it difficult for users to understand the data and take action based on it. Adhering to key design principles and testing the dashboard ensures users have an optimal experience and have the data required to make better decisions.
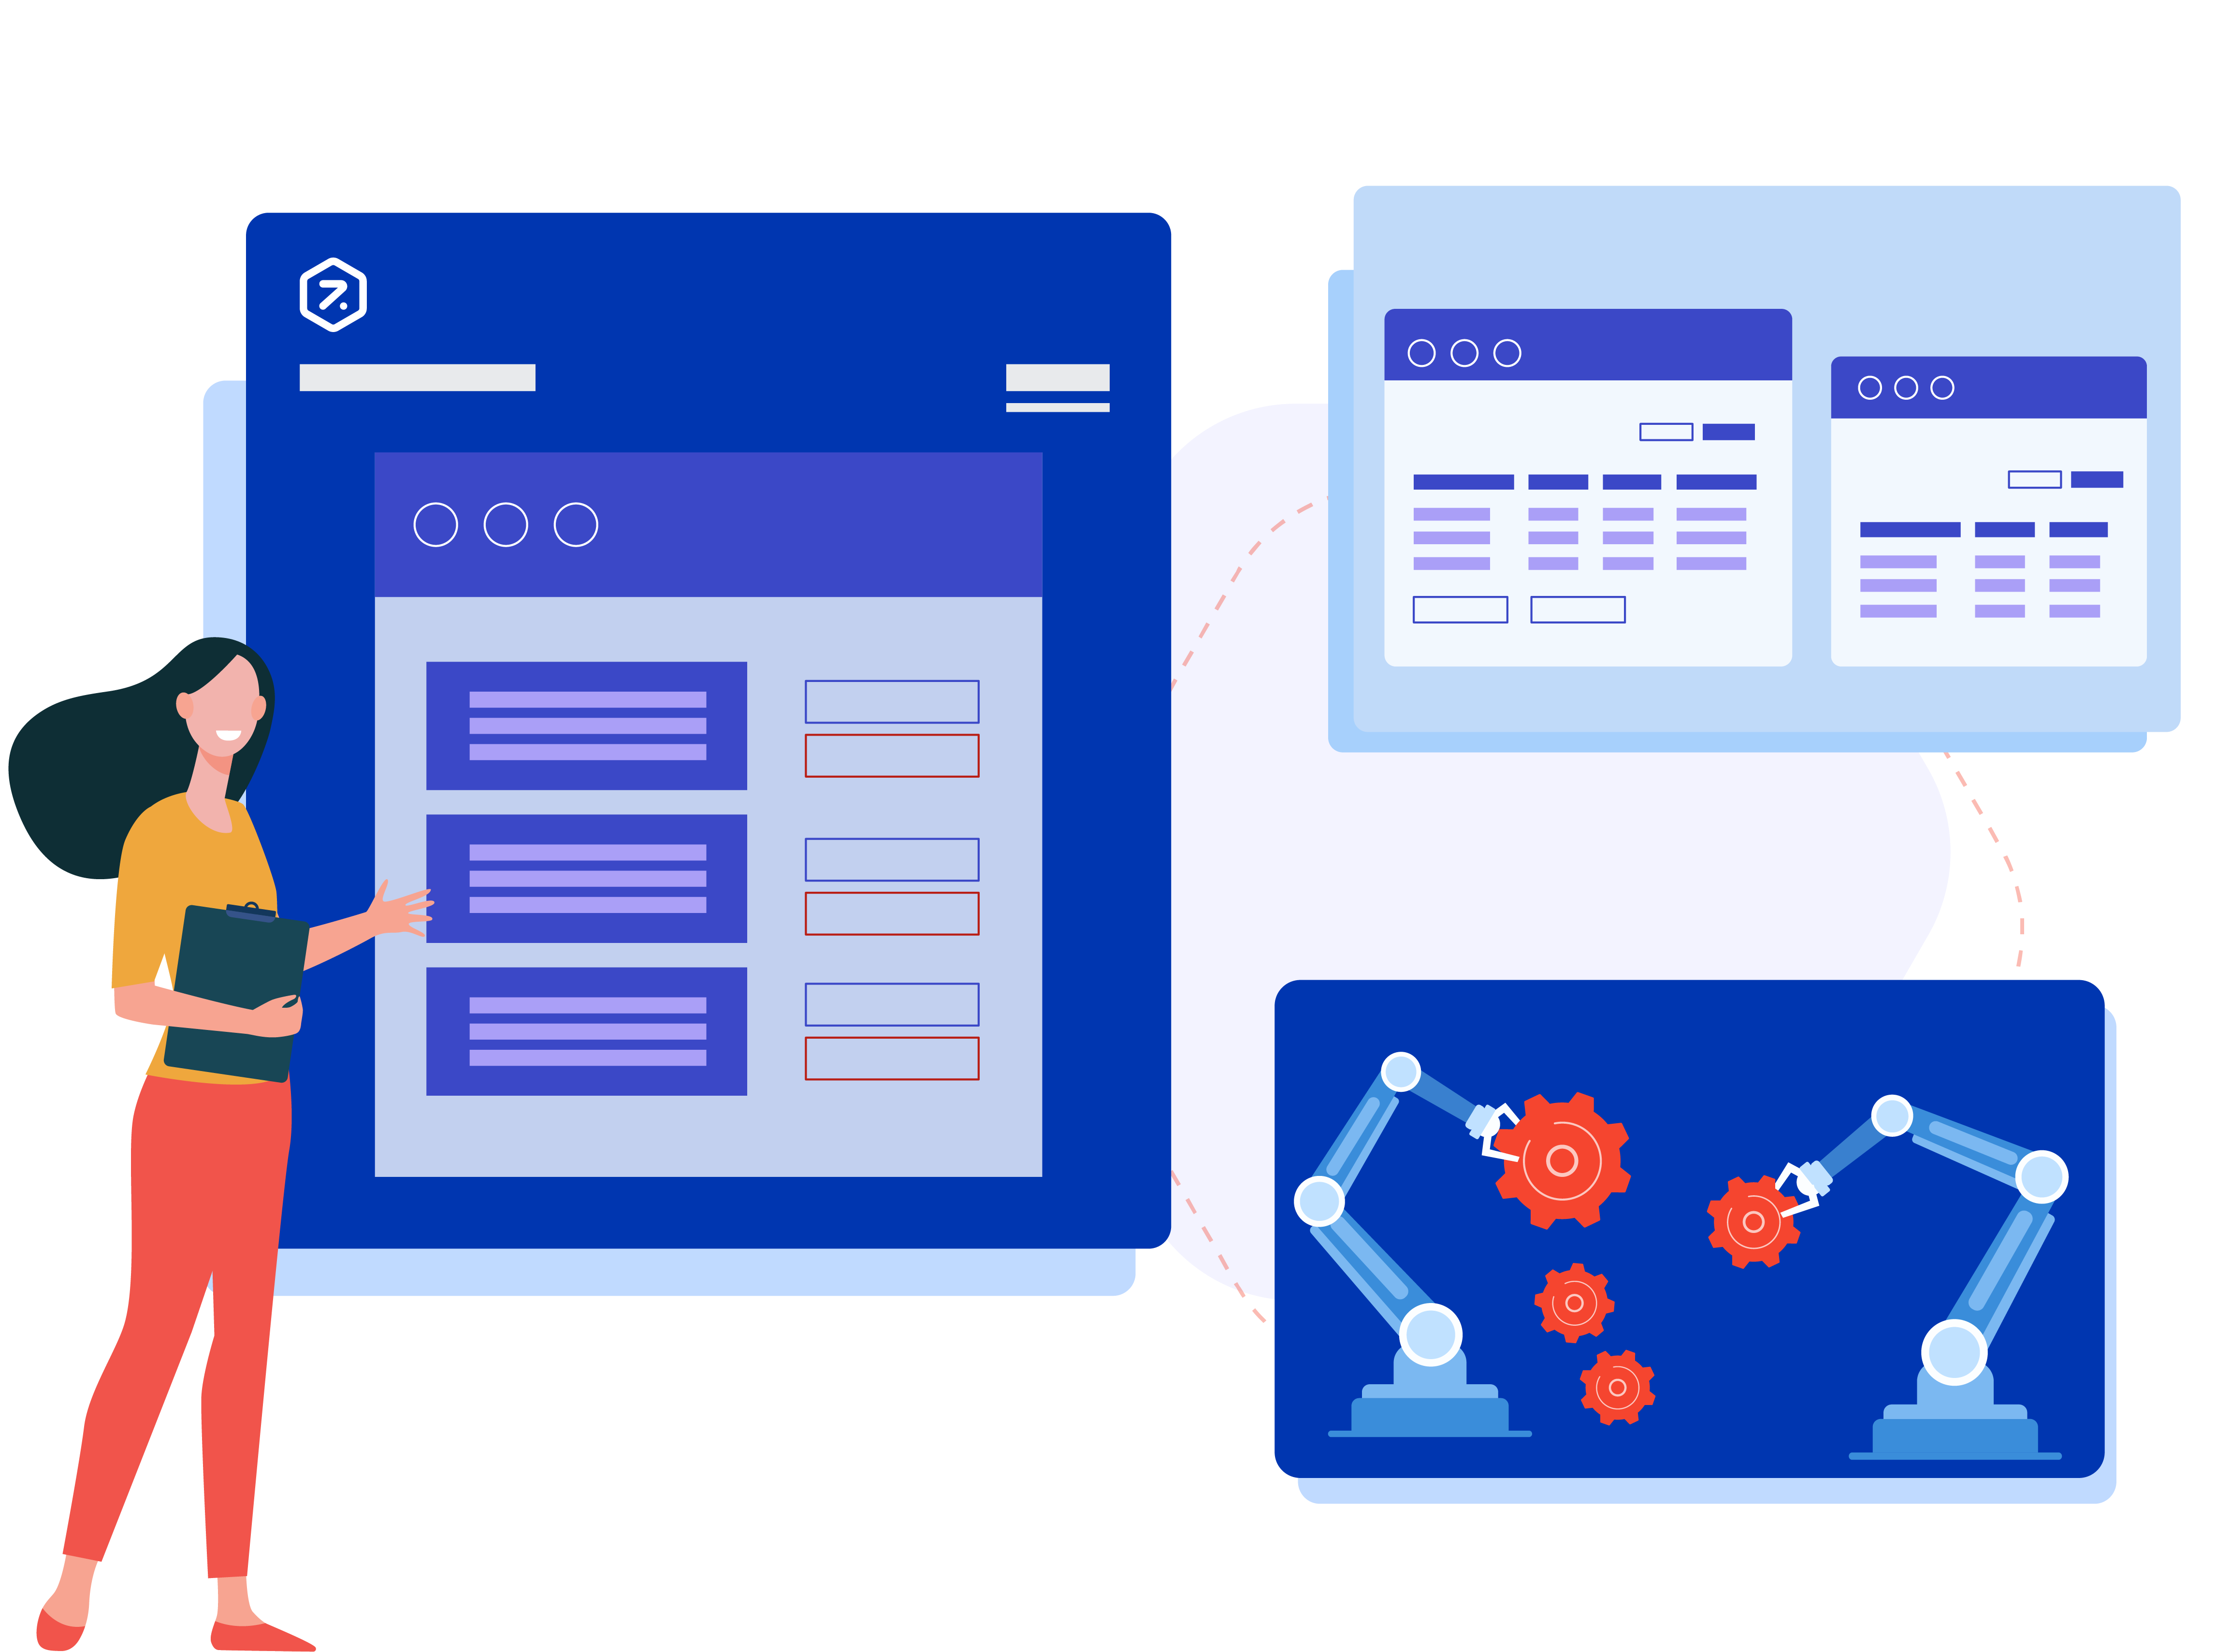
Dashboards, SRM and Procurement
In the context of supplier relationship management, dashboards provide a birds eye view of individual supplier performance, as well as the overall health of the organization’s relationships with them. Dashboards provide real-time, easy-to-understand information about an organization’s relationships with its suppliers. For example, a dashboard could display data on the quality of goods and services received from suppliers, the timeliness of deliveries, and the responsiveness of suppliers to the organization’s needs.
Monitor Supplier Performance Better
Procurement teams need a dashboard view to have a clear, concise, and real-time understanding of the organization’s relationships with its suppliers. Supplier Performance Management Dashboards can help procurement teams identify trends, spot problems, and take corrective action. With the information at hand, procurement teams make more informed decisions, improve their negotiations with suppliers, and ensure that the organization is getting the best possible value for its purchases. The dashboard view is important for procurement teams to manage their relationships with suppliers more effectively.
Sometimes, a dashboard may come across like a cockpit to a pilot. Overwhelmingly complex with a load of data and information flowing in one direction. But to the pilot, it is a seamless placeholder of critical information that helps them fly the plane. And that is what dashboards can be to procurement professionals with Supplier Relationship Management tools. Dashboards can help with streamlining SRM by providing a quick and easy way to access and analyze data that is relevant to a part and supplier and make decisions based on them. In short, the robustness of dashboard features leads to faster and more informed decisions, supplier risk mitigation and help in maintaining effective supplier relations.